What's Going On Dashboard
Description
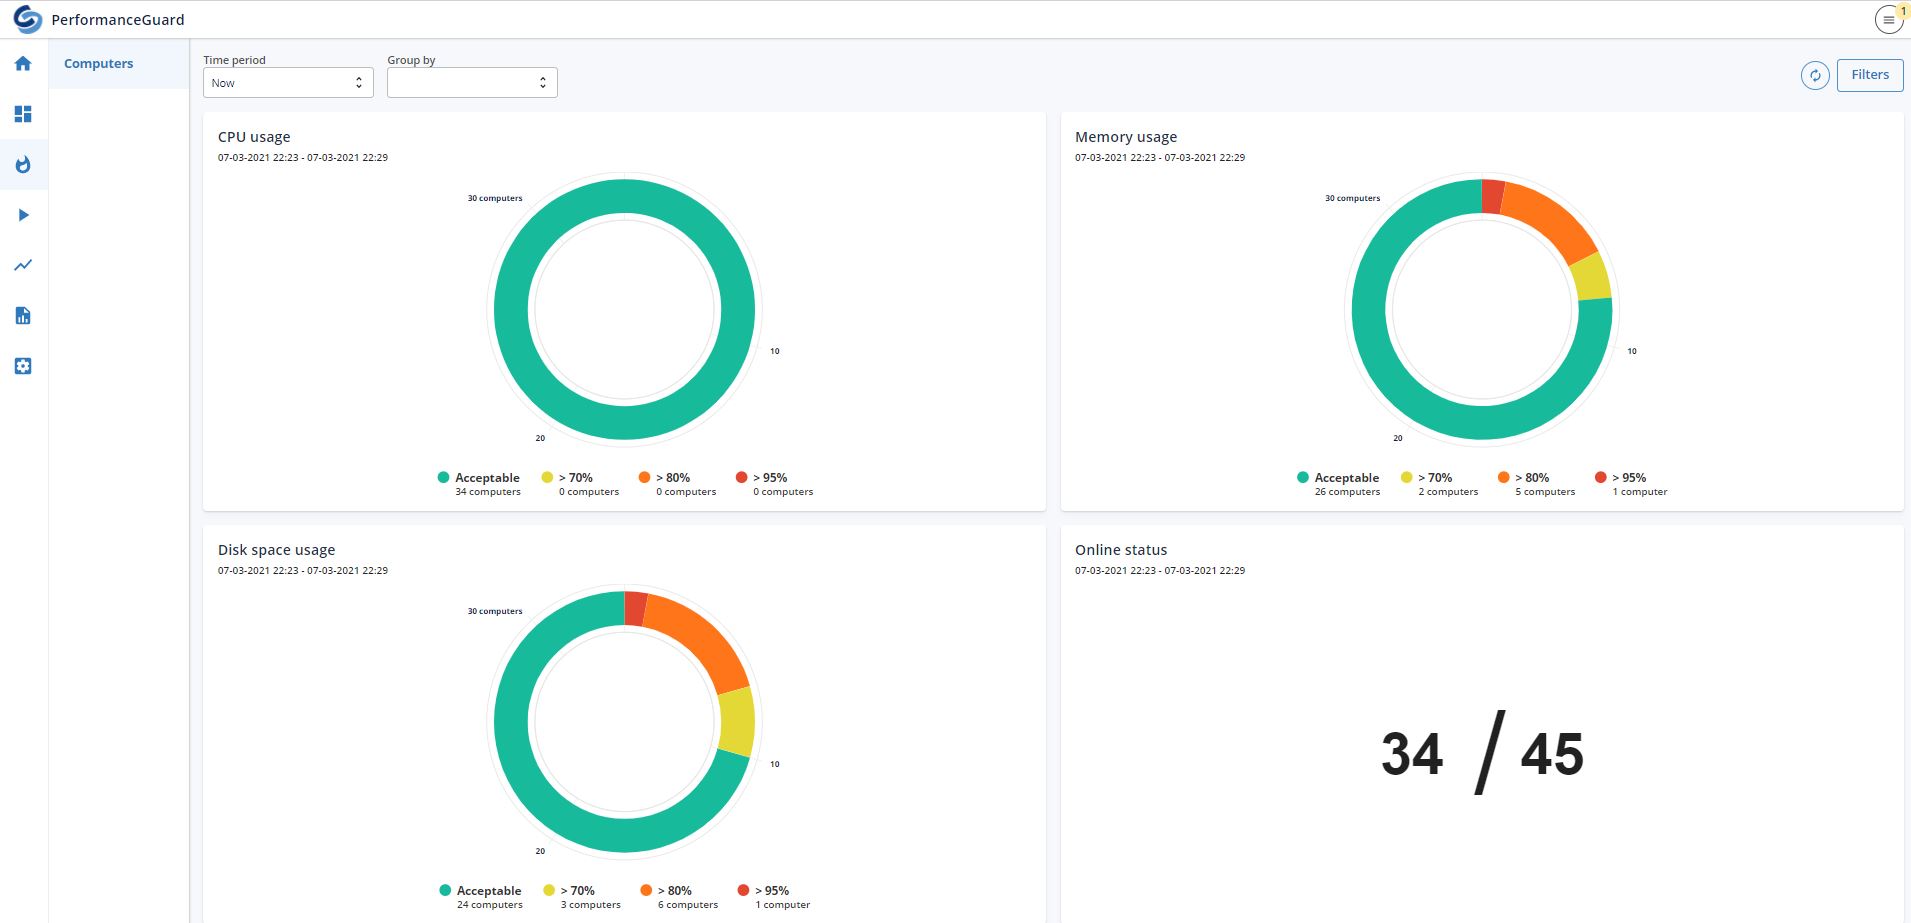
The purpose of the What’s Going On (WGO) dashboard is to quickly give insight into all computers performance in your organization.
In this version, you get information about CPU- and memory usage near to real-time. Furthermore, disk space usage and agent online count is also collected and displayed.
The graphs automatically sort the clients by using the respective metrics, and from there, it is possible to drill down to view a single client’s performance and the processes that use them.
With the filters, you can sort and compare clients based in the collected inventory like OS version, computer model, vendor, etc.
Data collection and retention time
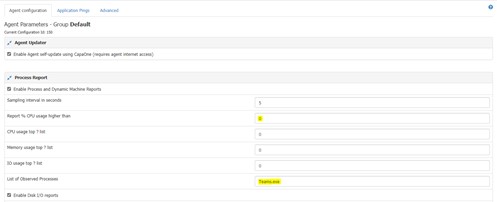
The data collected from the clients depends on the configuration group they belong to.
Here you configure the sort of report each agent sends back to the PerformanceGuard server.
Essential for the understanding of WGO is that as the default setting, only processes that utilize more than one percent CPU will figure on the list.
If you want to monitor a specific process, it should be added to each client's configuration group under the “List of observed processes”. By doing so, the process will always be monitored and reported back to, e.g. WGO.
An alternate option is to monitor all processes by setting “Report % CPU usage higher than” to “0”. This option is not recommended for all clients as this increases the database size significantly.
Read more about agent configuration groups here.
Filters
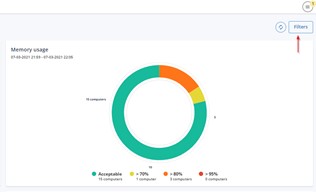
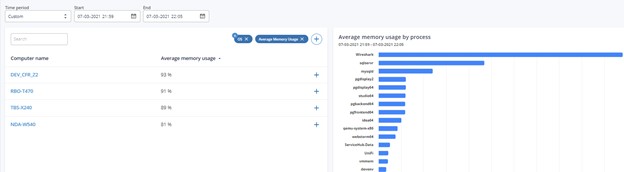
When using WGO, you can apply filters to sort clients and servers by inventory.
Applying a filter from the upper right corner applies to all diagrams and tables on the dashboard.
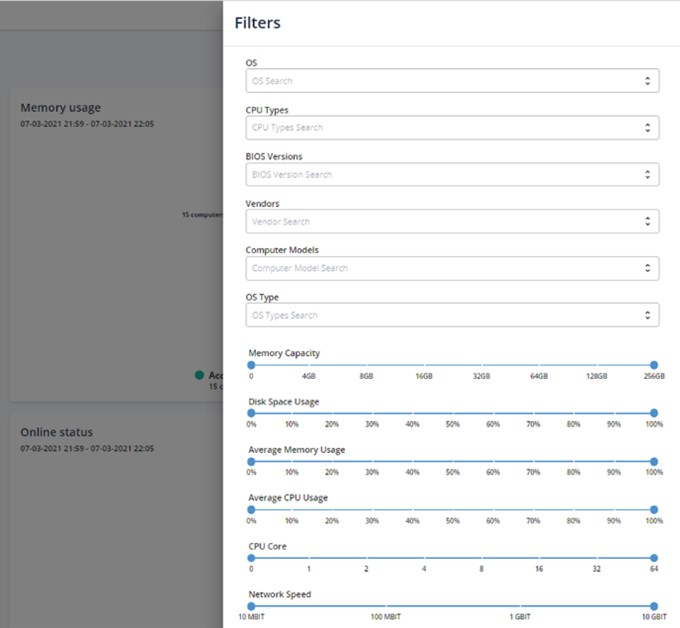
If you show and apply a filter from within the table's frame, it applies only to that table.
In the case below, the board only filters computer clients, not the processes on the right.
Metrics
Suppose a process is spawned multiple times in the same time interval. In that case, the memory consumption is calculated as the total of "Committed" memory divided by the number of reports within the time interval.
"Committed" memory is the amount of virtual memory the operating system has reserved for a process. The memory includes the amount of physical memory in-use and any pages that have been saved in the page file.
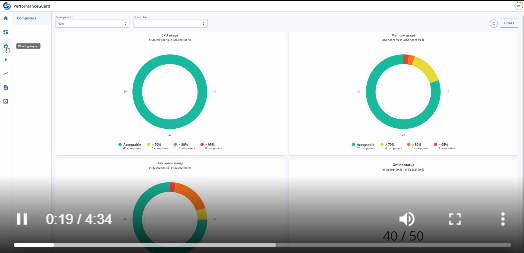
Get to know WGO
A Short video that takes you through the features in WGO, click the image.
Search this documentation
On this page
In this section