Widget Templates
PerformanceGuard 8.0 allows you to add a set of widgets directly on the dashboard you are working with. The widget set are fetched from CapaSystems Cloud Solution is regularly being update.
Application Dashboard
This template provides an overview of the performance of all business critical applications. This quick overview can be useful for Service Desk, Problem Management and IT Operation etc.
The application dashboard shows you whether applications perform on an acceptable level. If not, it will show you the extent to which your organization is affected.
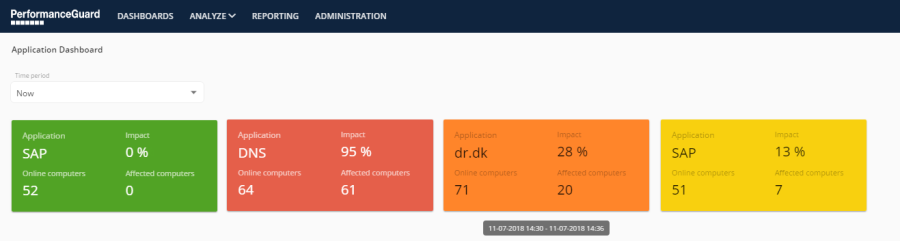
Typical examples of applications are Exchange servers, domain controllers, DNS, file servers, or any other business-critical applications.
Application Dashboard uses Application Status Widget that is based on event rules. PerformanceGuard comes with the predefined event rules and the widget for each application indicates the status with a color signifying the current performance degradation impact.
Application Performance Overview
This dashboard provides a quick overview of how your applications perform.
Computer Overview
This template is ideal if you work in Support, Service Desk, etc., because you can search for a computer and instantly view:
- The computer's IP addresses, location, operating system, currently logged-in user, network speed and type, etc.
- Disk usage, CPU usage, memory usage, sent/received bytes, read/write I/O, startup and login times.
- How the computer performs compared with other computers.
- A timeline of events. Remember what an event is? It's a threshold violation, for example a response time that isn't acceptable.
Detailed Computer Analysis
This template is ideal for Problem Management as it allows the operator to identify the root cause by looking at the individual computers.
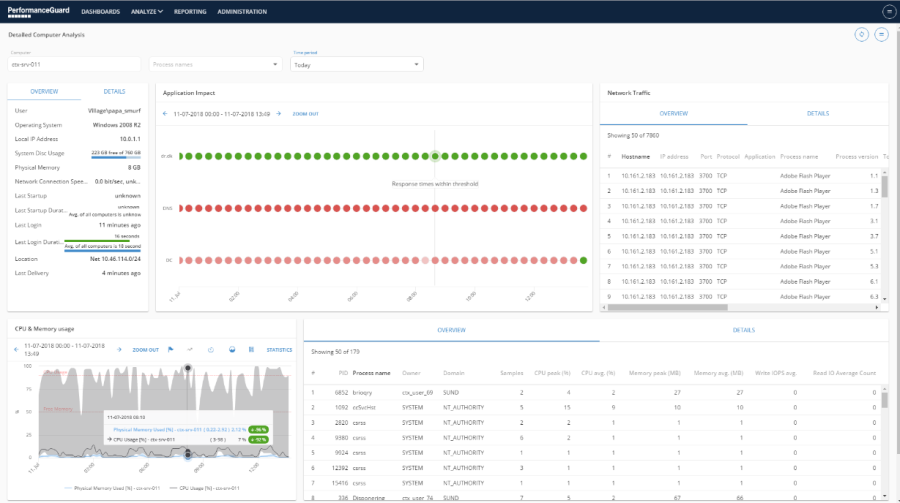
This dashboard is build with different widgets such as Computer Info, Computer Chart, and Computer Bubble Chart among many others.
These collective widgets on this dashboard display collected information about the computer hardware specification as well as resource data such as CPU, Memory, Disk or Windows Performance Counters. It also allows you to investigate the network traffic using Network Traffic List Widget if the problems lie within the network or NIC. You can also identify which processes are using resources more than the others.
SQL Server - Windows Performance Counters
Performance counters are measurements of computers' states or activities. They're useful when you want to find out how computers are affected by what users do with them. This dashboard lets you view performance counters about your organization's SQL Servers.
Which Locations are Affected
This template allows you to determine the nature of an identified problem, identify if the problem is experienced by only 1 computer or many and where they are located etc.
The Service Desk and Problem Management team can use this dashboard to identify between network or application server problem.
This dashboard is build with two widgets Location Sunburst and Location Bubble Chart allowing operators to distinguish between: Network problem i.e. the affected computers are in one location or one branch of your location tree OR Application Server problem i.e. the affected computers are spread over all locations. 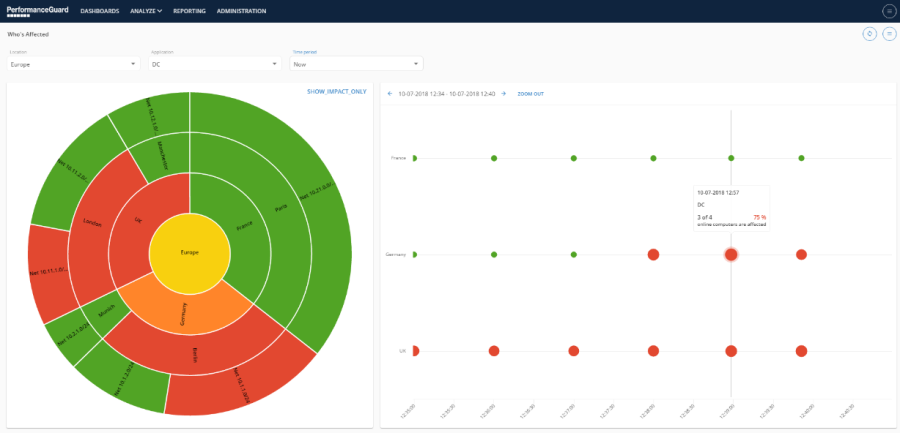
Which Applications are Affected
Like the 'Which Locations are Affected' template, the 'Which Application are Affected'-template can be used to trouble shoot which applications a poor performing.
Search this documentation
On this page
In this section